
How to Calculate Slope in Excel Using the SLOPE Function
To calculate slope in Excel, enter your x-values and y-values in separate columns, then use the built-in SLOPE function. The formula is =SLOPE(known_y's, known_x's). Excel uses these paired values to calculate the slope of a linear regression line, showing how much the y-variable changes for each unit increase in x.
For example, if you have measurements of horizontal distance and elevation at several points along a site, Excel can calculate the overall linear trend without requiring you to calculate the slope between every pair manually.
The important detail is the order of the arguments: enter the y-values first and the x-values second.
What Does the SLOPE Function Do in Excel?
Excel’s SLOPE function calculates the slope of a linear regression line using two sets of numerical data.
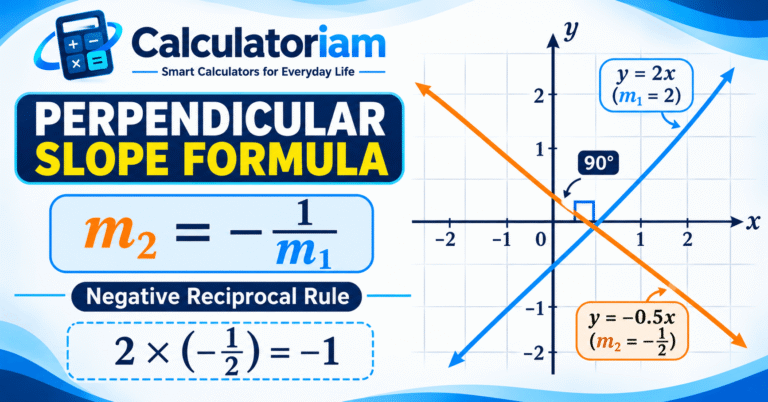
A slope describes the rate of change between two variables. In coordinate geometry, it represents vertical change divided by horizontal change.
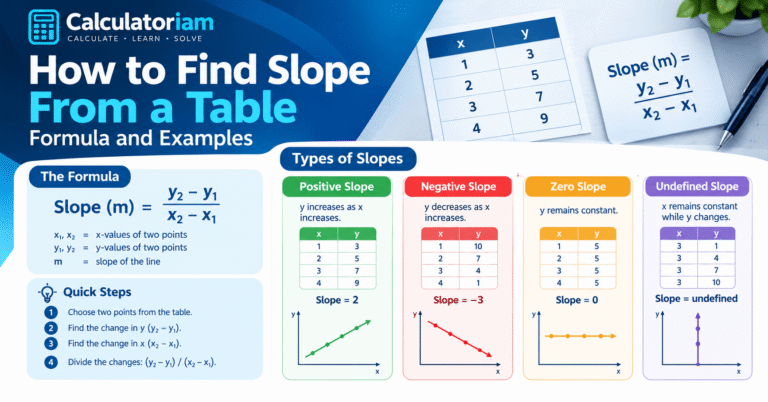
The standard two-point slope formula is:
m=\frac{y_2-y_1}{x_2-x_1}
Where:
- m = slope of the line.
- y1 = y-coordinate of the first point.
- y2 = y-coordinate of the second point.
- x1 = x-coordinate of the first point.
- x2 = x-coordinate of the second point.
Excel applies a related principle through statistical regression.
When you provide more than two observations, the SLOPE function calculates the slope of the best-fit straight line through the data. This means the result uses all the paired observations rather than simply comparing the first and last values.
According to Microsoft’s official SLOPE function documentation, the function returns the slope of the linear regression line through the known y-values and known x-values.
Excel SLOPE Function Syntax
The function follows this syntax:
=SLOPE(known_y's, known_x's)
Its two required arguments are:
| Argument | Meaning |
|---|---|
| known_y’s | The range containing dependent or output values. |
| known_x’s | The range containing independent or input values. |
For example, if your x-values are stored in A2 and your y-values are stored in B2, enter:
=SLOPE(B2:B6,A2:A6)
Notice that the B column comes first because it contains the y-values.
How to Calculate Slope in Excel Step by Step
You can calculate slope in Excel using a small dataset and one formula. Follow these steps to obtain the result.
Step 1: Enter Your X and Y Values
Open Microsoft Excel and create a blank worksheet.
Enter your independent variable (x) in the first column and your dependent variable (y) in the second column.
For example:
| Horizontal Distance (X) | Elevation (Y) |
|---|---|
| 0 | 100.0 |
| 10 | 100.2 |
| 20 | 100.4 |
| 30 | 100.5 |
| 40 | 100.8 |
Each row represents one observation. Keep the x-value and its corresponding y-value together in the same row.
Step 2: Select an Empty Cell
After entering your data, click an empty cell where you want Excel to display the calculated slope.
For this example, select cell D2.
You do not need to select the entire dataset before entering the formula.
Step 3: Enter the SLOPE Formula
Type the following formula into D2:
=SLOPE(B2:B6,A2:A6)
The first range, B2, contains the elevation measurements. The second range, A2, contains the horizontal distances.
Make sure both ranges contain the same number of corresponding observations.
Step 4: Press Enter and Read the Result
Press Enter to calculate the slope.
Excel returns:
Slope = 0.019
This means the fitted linear trend increases by approximately 0.019 feet in elevation for every 1 foot of horizontal distance.
You have now calculated the slope using Excel’s built-in statistical function.
Worked Example: Calculate Slope Using Excel Data
Consider a construction site where elevation measurements have been recorded at different horizontal distances.
The objective is to determine the average upward grade represented by the measurements.
The following dataset contains five observations:
| Distance (ft) | Elevation (ft) |
|---|---|
| 0 | 100.0 |
| 10 | 100.2 |
| 20 | 100.4 |
| 30 | 100.5 |
| 40 | 100.8 |
Both variables use feet, so the resulting slope can be interpreted as an elevation change per foot of horizontal distance.
Step 1: Apply the Excel Formula
Enter:
=SLOPE(B2:B6,A2:A6)
Excel calculates the slope using all five measurement pairs.
Step 2: Calculate the Percentage Grade
The returned slope is approximately 0.019.
To express this value as a percentage, multiply it by 100.
G=0.019\times100=1.9%
Answer: The estimated linear grade is 1.9%.
This means the fitted elevation trend rises approximately 1.9 feet for every 100 feet of horizontal distance.
Step 3: Calculate the Slope Angle (Optional)
If you also need the angle of the fitted line, use the inverse tangent function.
In Excel, enter:
=DEGREES(ATAN(SLOPE(B2:B6,A2:A6)))
The approximate result is:
Slope angle = 1.0885°
This angle describes the direction of the fitted linear trend, not a separate measurement of every individual section of the site.
How to Convert Excel Slope Into a Percentage
Excel normally returns the slope as a numerical value rather than automatically displaying it as a percentage.
You can convert the result using either of these methods.
Method 1: Multiply by 100
Enter:
=SLOPE(B2:B6,A2:A6)*100
For the worked example, Excel returns 1.9.
You can label the result as 1.9%.
Method 2: Format the Result as a Percentage
Alternatively, enter:
=SLOPE(B2:B6,A2:A6)
Then select the result cell and choose Percentage from Excel’s Number Format options.
Excel displays 1.90%.
Do not multiply the result by 100 and then apply percentage formatting. Doing both would incorrectly display 190%.
Important: The x- and y-values must use compatible units before interpreting the slope as a percentage grade. If elevation is recorded in inches and horizontal distance in feet, convert one measurement so both use the same unit.
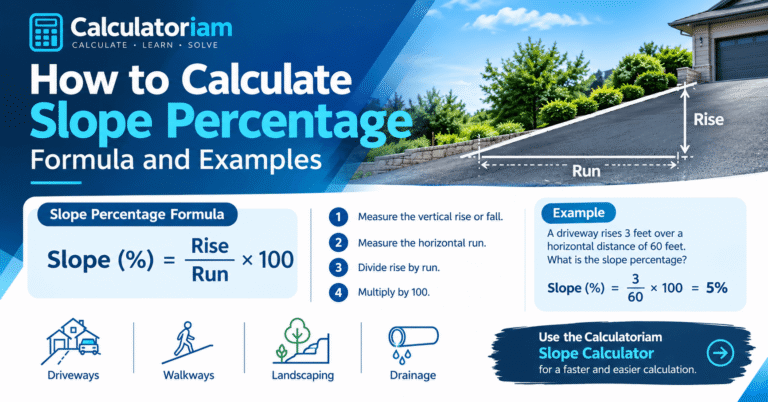
For a direct physical rise-and-run calculation, you can also use Calculatoriam’s Slope Calculator, which calculates grade percentage and slope angle from entered measurements.
Difference Between Excel’s SLOPE Function and the Two-Point Formula
Although both methods calculate slope, they do not always produce the same result.
The traditional two-point formula uses two selected coordinates. Excel’s SLOPE function uses all available paired observations to calculate a best-fit regression line.
| Feature | Two-Point Formula | Excel SLOPE Function |
|---|---|---|
| Data required | Two points | Two or more paired observations |
| Calculation | Rise divided by run | Linear regression |
| Uses all observations | No | Yes |
| Best suited for | Exact slope between two points | Overall linear trend |
| Result | Slope between selected points | Best-fit line slope |
Consider the earlier elevation example.
Using only the first and last measurements:
m=\frac{100.8-100.0}{40-0}=0.02
The endpoint calculation gives a slope of 0.02, equivalent to a 2% grade.
However, Excel’s SLOPE function returns 0.019, equivalent to a 1.9% grade.
The difference occurs because Excel considers all five observations when fitting its regression line.
If you want to calculate slope manually from coordinate pairs, see our guide on how to find slope from a table.
How to Interpret Positive, Negative, and Zero Slope in Excel
The sign and size of the calculated slope help explain the relationship between your two variables.
| Slope Result | Meaning | Interpretation |
|---|---|---|
| Positive | Increasing relationship | Y generally increases as X increases. |
| Negative | Decreasing relationship | Y generally decreases as X increases. |
| Zero | No overall linear change | The fitted line is horizontal. |
| Close to zero | Nearly horizontal trend | Y changes very little relative to X. |
A positive result may represent rising elevation over distance, while a negative result can represent a descending surface.
A zero result indicates that the fitted linear relationship has no overall increase or decrease. It does not necessarily mean that every individual observation is identical.
Remember that slope alone does not establish how closely the data follows a straight line. A dataset with substantial variation may still produce a numerical regression slope.
Common Excel SLOPE Function Errors and How to Fix Them
Excel can return an error or an unexpected result when the input ranges are incorrect or the data does not support a defined regression slope.
1. #N/A Error
This error can occur when the known y-values and known x-values are empty or contain different numbers of data points.
How to fix it:
- Check both selected ranges.
- Make sure the ranges contain corresponding numerical observations.
- Remove unintended missing or invalid entries.
- Confirm that both arguments cover the intended dataset.
2. #DIV/0! Error
This error can occur when the x-values do not vary. For example, if every x-value is 5, Excel cannot calculate a unique regression slope.
How to fix it:
- Check whether the x-values are identical.
- Confirm that your dataset contains enough valid information to calculate a slope.
- Make sure the independent variable has meaningful variation.
3. Reversing the X and Y Ranges
One of the most common mistakes is entering the x-range before the y-range.
Incorrect:
=SLOPE(A2:A6,B2:B6)
Correct:
=SLOPE(B2:B6,A2:A6)
The correct order is always known y-values first, followed by known x-values.
4. Including Incorrect or Unmatched Data
Excel ignores text, logical values, and empty cells within referenced arrays, but includes numerical zeros.
Consequently, a worksheet containing unexpected blank cells or text entries may not produce the result you intended.
How to fix it:
- Review the original observations.
- Remove unintended text and missing entries.
- Keep each x-value paired with its correct y-value.
- Do not sort one column independently of the other.
5. Mixing Measurement Units
Using different units for the independent and dependent variables can make the slope difficult to interpret.
For example, recording horizontal distance in feet and elevation in inches produces an output in inches per foot, not a directly usable percentage grade.
Convert the measurements into compatible units before calculating a percentage.
Frequently Asked Questions
What is the formula for calculating slope in Excel?
The Excel formula is =SLOPE(known_y's, known_x's). The first argument contains the dependent y-values, while the second contains the independent x-values. Excel returns the slope of the linear regression line through the supplied observations.
Can Excel calculate slope from two points?
Yes. Enter the two y-values in one range and the corresponding x-values in another. The SLOPE function returns the same result as the traditional two-point formula when the x-coordinates are different.
Does Excel calculate slope using all data points?
Yes. When multiple paired observations are supplied, Excel uses the available numerical data to calculate a best-fit linear regression slope. It does not simply subtract the first measurement from the last.
How do I calculate percentage slope in Excel?
Multiply the result of the SLOPE function by 100 when both variables use compatible units.
For example, =SLOPE(B2:B6,A2:A6)*100 converts a slope of 0.019 into a percentage grade of 1.9%.
Why does Excel return a negative slope?
A negative slope indicates that the dependent variable generally decreases as the independent variable increases. For example, elevation measurements may produce a negative result when a site descends along the direction of measurement.
Can I use Excel to calculate slope from a table?
Yes. Arrange the x-values and corresponding y-values in two columns, then apply the SLOPE function to their respective ranges. Excel calculates the overall linear trend using the paired observations.
Conclusion
Calculating slope in Excel is straightforward once your x-values and y-values are organized correctly. The built-in SLOPE function provides a convenient way to calculate the gradient of a linear regression line without manually performing the statistical calculations.
Remember to enter the y-range first, followed by the x-range, and keep corresponding measurements together. When working with construction measurements, also check your units before converting the result into a percentage grade.
For a direct calculation using vertical rise and horizontal run, you can use the Calculatoriam Slope Calculator to calculate slope, grade percentage, angle, and related measurements.