
How to Find Slope From a Table (Step-by-Step Examples)
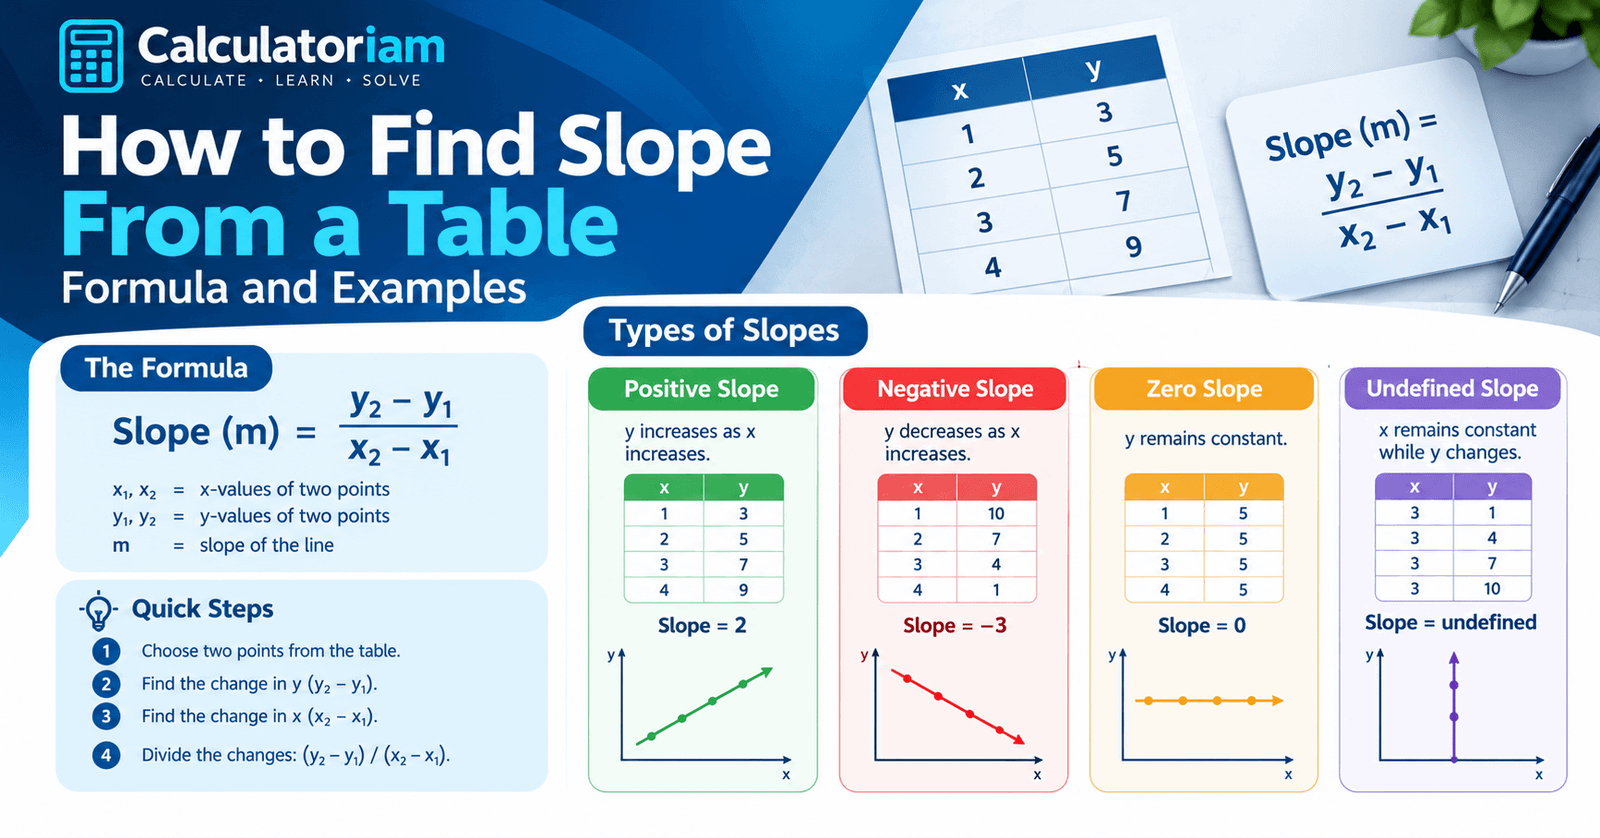
To find the slope from a table, choose two points, subtract their y-values, and divide the result by the difference between their x-values. This calculation shows how much y changes for every unit change in x.
The slope formula is:
Slope (m) = (y₂ − y₁) ÷ (x₂ − x₁)
For example, suppose a table contains the points (2, 4) and (6, 12).
Change in y = 12 − 4 = 8
Change in x = 6 − 2 = 4
Slope = 8 ÷ 4 = 2
Answer: The slope is 2.
This means y increases by 2 units whenever x increases by 1 unit.
Understanding how to calculate slope from a table helps you solve algebra problems, analyze linear relationships, and interpret rates of change without drawing a graph.
What Does Slope Mean in a Table?
A table of values shows the relationship between two variables, usually x and y. Each row represents a coordinate pair written as (x, y).
Slope measures the rate at which y changes compared with x.
Consider the following table:
| x | y |
| 1 | 3 |
| 2 | 5 |
| 3 | 7 |
| 4 | 9 |
Notice the pattern:
- The x-values increase by 1.
- The y-values increase by 2.
- The ratio of these changes remains constant.
Therefore:
Slope = 2 ÷ 1 = 2
The table represents a linear relationship because the rate of change remains constant.
A positive slope indicates an increasing relationship. A negative slope represents a decreasing relationship. Zero slope describes a horizontal line, while an undefined slope occurs when the horizontal change is zero.
Formula for Finding Slope From a Table
The standard formula for calculating slope is:
m = (y₂ − y₁) ÷ (x₂ − x₁)
Here:
- m: Slope of the line.
- x₁: First x-coordinate.
- y₁: First y-coordinate.
- x₂: Second x-coordinate.
- y₂: Second y-coordinate.
You can also express the formula as:
Slope = Change in y ÷ Change in x
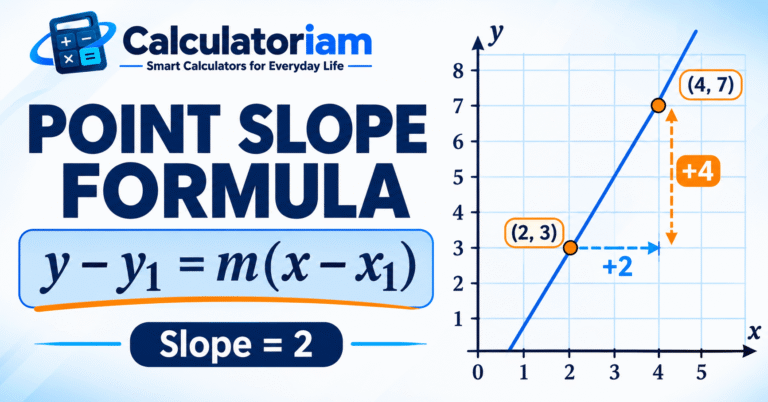
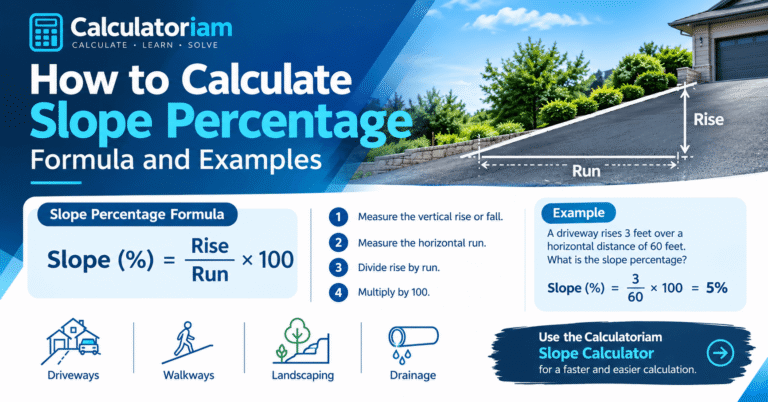
The change in y is called the rise, while the change in x is called the run.
For a detailed explanation, read our Rise Over Run Guide.
When using the formula, subtract both coordinates in the same order. Reversing both differences produces the same slope, but reversing only one changes the sign incorrectly.
How to Find Slope From a Table Step by Step
Follow these four steps to calculate slope from any table representing a linear relationship.
Step 1: Choose Two Points
Consider the following table:
| x | y |
| 2 | 4 |
| 4 | 8 |
| 6 | 12 |
| 8 | 16 |
Select two points:
First point: (2, 4)
Second point: (6, 12)
The coordinates are:
x₁ = 2, y₁ = 4
x₂ = 6, y₂ = 12
Step 2: Calculate the Change in y
Subtract the first y-value from the second.
Change in y = y₂ − y₁
Change in y = 12 − 4 = 8
The vertical change is 8.
Step 3: Calculate the Change in x
Subtract the first x-value from the second.
Change in x = x₂ − x₁
Change in x = 6 − 2 = 4
The horizontal change is 4.
Step 4: Divide the Changes
Use the slope formula:
Formula: Change in y ÷ Change in x
Substitute the values: 8 ÷ 4
Final Answer: The slope is 2.
The relationship has a positive slope of 2.
To verify the answer, select another pair of points.
Using (4, 8) and (8, 16):
Slope = (16 − 8) ÷ (8 − 4)
Slope = 8 ÷ 4 = 2
Both calculations produce the same result.
Examples of Finding Slope From a Table
The following examples explain how to identify different types of slopes using tables.
Example 1: How to Find a Positive Slope From a Table
Consider this table:
| x | y |
| 1 | 3 |
| 2 | 5 |
| 3 | 7 |
| 4 | 9 |
Choose the points (1, 3) and (3, 7).
Apply the slope formula:
m = (7 − 3) ÷ (3 − 1)
m = 4 ÷ 2
Answer: m = 2
The slope is positive because y increases as x increases.
Example 2: How to Find a Negative Slope From a Table
Consider the following values:
| x | y |
| 1 | 10 |
| 2 | 7 |
| 3 | 4 |
| 4 | 1 |
Choose the points (1, 10) and (3, 4).
Calculate:
m = (4 − 10) ÷ (3 − 1)
m = −6 ÷ 2
Answer: m = −3
The negative slope means y decreases by 3 units whenever x increases by 1 unit.
Example 3: How to Find a Fractional Slope From a Table
Not every slope is a whole number.
Consider this table:
| x | y |
| 2 | 3 |
| 4 | 6 |
| 6 | 9 |
| 8 | 12 |
Choose the points (2, 3) and (6, 9).
Calculate:
m = (9 − 3) ÷ (6 − 2)
m = 6 ÷ 4
Answer: m = 3/2 = 1.5
The slope is 1.5, meaning y increases by 1.5 units for every unit increase in x.
Example 4: How to Find Zero Slope From a Table
Consider the following table:
| x | y |
| 1 | 5 |
| 2 | 5 |
| 3 | 5 |
| 4 | 5 |
Choose the points (1, 5) and (4, 5).
Calculate:
m = (5 − 5) ÷ (4 − 1)
m = 0 ÷ 3
Answer: m = 0
The slope is zero because the y-values remain constant while the x-values change.
This table represents a horizontal line.
Example 5: How to Find Undefined Slope From a Table
Consider this table:
| x | y |
| 3 | 1 |
| 3 | 4 |
| 3 | 7 |
| 3 | 10 |
Choose the points (3, 1) and (3, 7).
Calculate:
m = (7 − 1) ÷ (3 − 3)
m = 6 ÷ 0
Answer: The slope is undefined.
Division by zero is undefined.
Because the x-values remain constant, the points form a vertical line.
How to Check Whether a Table Has a Constant Slope
Not every table represents a linear relationship. To determine whether the slope is constant, compare the change in y with the corresponding change in x between consecutive points.
Consider this table:
| x | y |
| 1 | 2 |
| 2 | 5 |
| 3 | 8 |
| 4 | 11 |
Calculate the slope between each pair of consecutive points.
First interval:
Slope = (5 − 2) ÷ (2 − 1) = 3
Second interval:
Slope = (8 − 5) ÷ (3 − 2) = 3
Third interval:
Slope = (11 − 8) ÷ (4 − 3) = 3
Every interval produces the same slope.
Answer: The table represents a linear relationship with a constant slope of 3.
What if the Slope Changes Between Rows?
Consider another table:
| x | y |
| 1 | 2 |
| 2 | 4 |
| 3 | 9 |
| 4 | 16 |
Calculate the changes between consecutive points.
First interval: 2 ÷ 1 = 2
Second interval: 5 ÷ 1 = 5
Third interval: 7 ÷ 1 = 7
The slopes are different.
Therefore, the points do not lie on one straight line.
You can calculate the average rate of change between selected points, but a single constant slope cannot describe the entire relationship.
How to Find Slope When x-Values Are Not Equally Spaced
The x-values in a table do not need to increase by exactly 1.
Consider the following table:
| x | y |
| 2 | 3 |
| 5 | 9 |
| 9 | 17 |
| 14 | 27 |
Choose the points (2, 3) and (9, 17).
Apply the formula:
m = (17 − 3) ÷ (9 − 2)
m = 14 ÷ 7
Answer: m = 2
Even though the x-values have unequal intervals, the relationship has a constant slope.
The important rule is to divide the actual change in y by the actual change in x.
Can You Use Any Two Points From a Table?
Yes. If a table represents an exact linear relationship, any two distinct points with different x-values will produce the same slope.
Consider this table:
| x | y |
| 1 | 4 |
| 2 | 7 |
| 3 | 10 |
| 4 | 13 |
| 5 | 16 |
Using the first two points:
m = (7 − 4) ÷ (2 − 1)
m = 3 ÷ 1 = 3
Using the first and last points:
m = (16 − 4) ÷ (5 − 1)
m = 12 ÷ 4 = 3
Both calculations give the same result.
However, if a table contains nonlinear data or rounded measurements, different pairs may produce different rates of change.
How to Find Slope From a Table With Negative Numbers
Negative coordinates can make slope calculations more challenging, especially when subtracting negative values.
Consider the following table:
| x | y |
| −3 | −7 |
| −1 | −3 |
| 1 | 1 |
| 3 | 5 |
Choose the points (−3, −7) and (1, 1).
Apply the slope formula:
m = (1 − (−7)) ÷ (1 − (−3))
Simplify the numerator:
1 − (−7) = 8
Simplify the denominator:
1 − (−3) = 4
Therefore:
m = 8 ÷ 4
Answer: m = 2
Remember that subtracting a negative number is equivalent to adding its positive value.
Common Mistakes When Finding Slope From a Table
Mixing Up x-Values and y-Values
The difference between y-values belongs in the numerator, while the difference between x-values belongs in the denominator.
Correct formula:
m = (y₂ − y₁) ÷ (x₂ − x₁)
Reversing these differences generally produces an incorrect result.
Subtracting Coordinates in Different Orders
Suppose the points are (2, 4) and (6, 12).
Correct calculation:
m = (12 − 4) ÷ (6 − 2) = 2
Also correct:
m = (4 − 12) ÷ (2 − 6) = 2
Both methods work because the subtraction order remains consistent.
Assuming Every Table Is Linear
A table may represent either a linear or nonlinear relationship.
Always compare the rates of change before concluding that the slope is constant.
Confusing Zero Slope With Undefined Slope
A horizontal line has zero slope because the change in y is zero.
A vertical line has undefined slope because the change in x is zero.
These situations are mathematically different.
Ignoring Negative Coordinates
Negative numbers require careful subtraction.
For example:
m = (3 − (−5)) ÷ (4 − 2)
m = 8 ÷ 2
Answer: m = 4
Using parentheses helps prevent sign errors.
Frequently Asked Questions
How do you find slope from a table?
Choose two points from the table. Subtract the first y-value from the second y-value, then divide by the corresponding difference between the x-values.
The formula is:
m = (y₂ − y₁) ÷ (x₂ − x₁)
What is the formula for slope from a table?
The slope formula is m = (y₂ − y₁) ÷ (x₂ − x₁). It measures how much y changes relative to x between two points.
Can you find slope without a graph?
Yes. A table provides the coordinate pairs needed to calculate slope directly. Drawing a graph is not necessary.
How do you know if a slope is positive or negative from a table?
When x-values are arranged in increasing order, rising y-values indicate a positive slope. Falling y-values indicate a negative slope.
What if the x-values do not increase by 1?
Use the actual difference between the x-values. The slope formula works even when the intervals are unequal.
Do you need consecutive rows to find slope?
No. For a linear relationship, you can select any two distinct points with different x-values.
Can a table have different slopes?
Yes. A nonlinear table may have different rates of change between different pairs of points.
What is the difference between slope and rate of change?
For a linear relationship, slope represents the constant rate of change. In a nonlinear relationship, the average rate of change may vary between intervals.
Conclusion
Finding slope from a table becomes straightforward once you understand how x-values and y-values work together.
Choose two points, calculate the change in y, calculate the change in x, and divide.
Remember the formula:
Slope (m) = (y₂ − y₁) ÷ (x₂ − x₁)
A positive slope indicates an increasing linear relationship, while a negative slope indicates a decreasing one. A horizontal line has zero slope, and a vertical line has undefined slope.
Practice with different tables to recognize patterns and improve your calculations.
For additional help, explore Calculatoriam’s Slope Calculator.


I always struggled with these tables at school, but your clear breakdown of the rise over run finally made it click for me. Brilliant stuff.